Avoid Financial Calvinism by Thinking Differently
Nothing makes sense anymore. Each day, it seems, the Dow Jones and the S&P eke to an ever greater All-Time High despite signs of a softening economy and murmurings from a tightening Fed. Even before the U.S. Presidential Election, this current Equity Bull Market had gained +255% from its cyclical low, besting the previous cyclical peaks of +205% and +100%. And since November 2016, the markets have climbed higher still.
Meanwhile, even with tightening on the horizon, the VIX, which measures the cost of stock market insurance, gets ever cheaper as the stock markets reaches ever new heights. For Bears, this particular juxtaposition of All-Time Highs and All-Time Lows can be unnerving.
Active or Passive Investing?
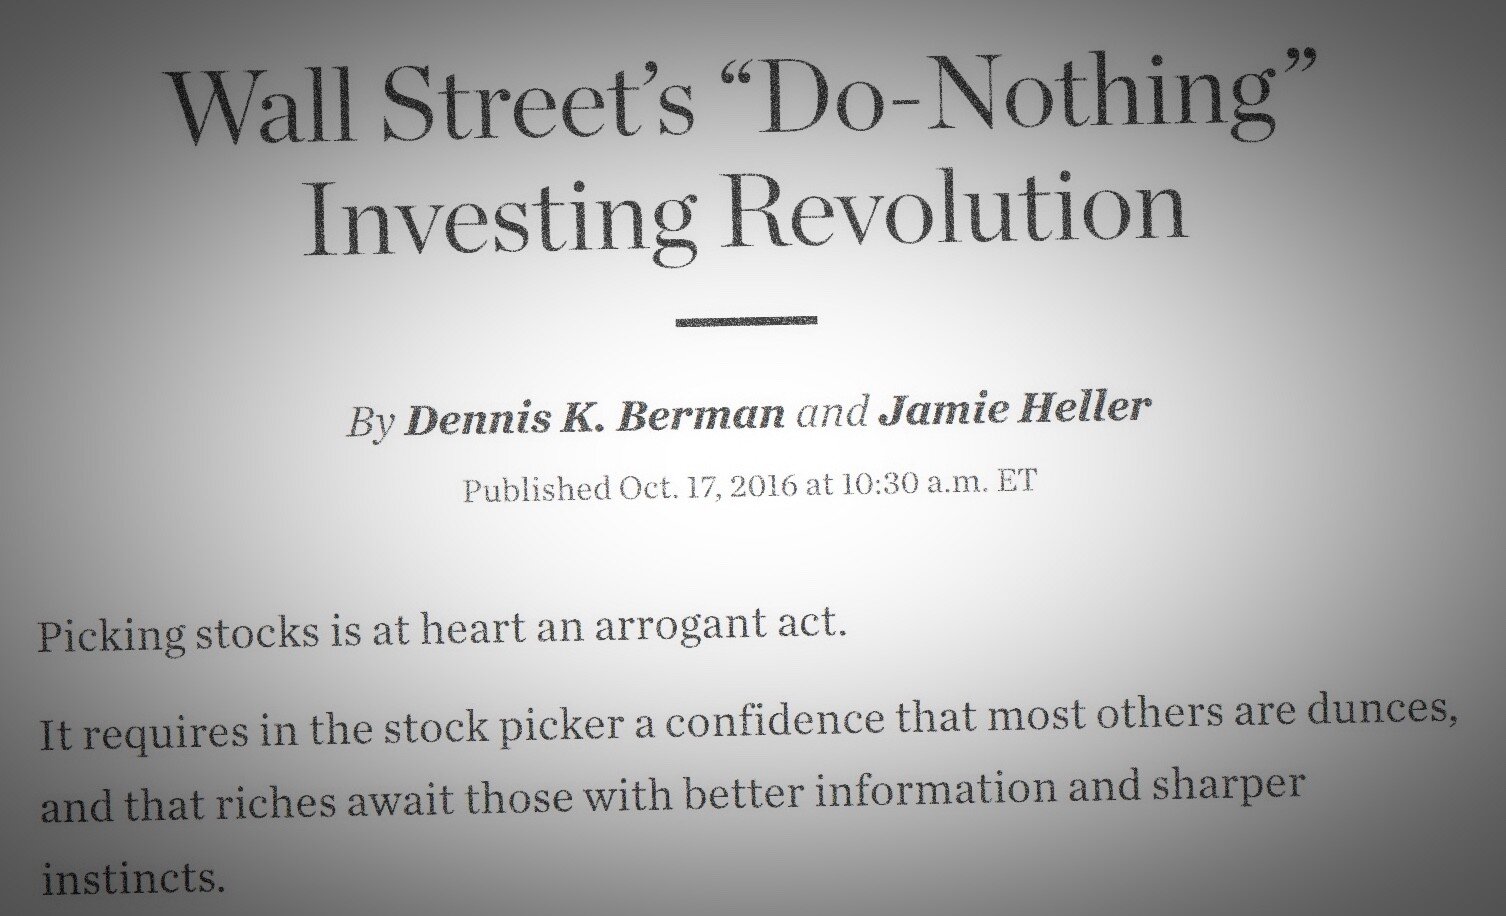
In October 2016, the Wall Street Journal prosecuted a war against active investing. This was just another sobering wake up call for the active management industry, which has been losing across the board to every form of rules-based strategy devised and marketed over the past 20 years. Is there any reason for investors to take another look at active investing?
The 10-Year Treasury Yield Interest rates are the price of money. Financial Analysts use interest rates to calculate fair value for stocks, bonds and real estate, and in every case, the lower the interest rate, the greater the value of the asset.
Since 1981, the 10-year yield on U.S. Treasury Bonds has declined from 16% to less than 3% in a one-way trade over 36 years. Practically speaking, in this Generational Bond Bull Market, no investor less than 55 years of age has experienced any environment outside of perpetually falling Interest Rates. This means that every investment strategy and every asset allocation framework have been built on a premise which is about to reverse with Fed tightening.
Normalization is Coming
Should Investors Favor High or Low R-Squared Strategies?
R-Squared is the Coefficient of Determination. I love the concept. No matter how complex the linear regression, the predictive value of that entire symbolic mess can be summed up with a simple statistic: R-Squared. Passive funds, by definition, tend to exhibit high R-Squared values, even a perfect 100%. When surveying the biggest U.S. Equity Large Cap Equity mutual funds, I found that, by choice, many actively managed funds have R-Squared values in excess of 90%. These funds effectively mimic the index by shadowing its composition and making a few modifications in hopes for out performance. However in down markets, by implication, these same funds with high R-Squared values will be dragged down by the performance of the benchmark index. To reiterate, R-Squared is the coefficient of determination, and as such, R-Squared is a double-edged sword.
The Situation
Investors Beware. R-Squared is The Measure of Conformity. Traditional asset allocation and investment performance evaluation frameworks have trained investors to think about mutual fund performance in two dimensions, performance and volatility. In this framework, risk-adjusted returns are measured by the Sharpe Ratio.
There is third a dimension which is individuality. Investors should also ask how an active manager is generating investment returns. Funds with lower R-Squared values demonstrate performance which is statistically less dependent on the underlying benchmark. For those wanting to fight the financial predetermination of investment performance, particularly when concerned about losing money, watch R-Squared.
Warning: High R-Squared May Be Hazardous to Your Financial Health
#meifx #activeinvesting Minyoung Sohn, CFA. Portfolio Manager, Meridian Equity Income Fund.
The Case for Active Construction
Summer Update Eclipse Edition
updated: October 16, 2017 (R-Squared)


