
April Fools Update

The Quarterly Update series was created to demystify Economics and Investing: First published on March 30, 2017 and last updated: March 30, 2018
Optimized for Apple iOS.
Spring Update
Setting Aside the Potential Trade War, which you can read about here:
Special Trade War Update | Act I. Domestic Politcal Economy
Special Trade War Update | Act II. China & Retaliation
I think the Economy is strong. Both U-3 and U-6 Unemployment are at their lowest levels in a decade, and this labor market tightness is finally starting to manifest in higher wage growth. However, I am concerned that Wage Growth is still not keeping pace with other key expenses such as Rent and Health Care, and this gap will negatively impact consumer attitudes to spending.
I would become very bullish on the Economy and the Markets - if - wage growth can sustain above cost inflation. This means the middle class consumer has expanding profit margins, which means more money available to put back into the Economy. Note that dynamic requires an Optimistic assessment of the future.
American Economic Nationalism and trade protectionism is the wildcard.

Growing up, nothing beat Calvin and Hobbes in full Sunday color. The strip, syndicated around the world, captured the essence and innocence of life while intertwining classical philosophical wit, all in the simple and ubiquitous medium of the daily newspaper. This version of the Quarterly Update is dedicated to Bill Watterson, the creator of Calvin and Hobbes.
Calvin and Hobbes by Bill Watterson (at Go Comics)
America's Middle Class
The Middle Class is shrinking. A generation ago, 3 in 5 Americans were in the middle class, but today, the number is only 1 in 2. As the class narrows and starts to swing politically, the political economy of this group matters.

"Middle-income" households have an annual income between 66 percent and 200 percent of the median U.S. household income, according to the Pew Research Center. As of 2014, that falls between $24,000 and $73,000 for one person and $42,000 and $126,000 for a family of three.
On an hourly basis, Middle Class begins at $12 per hour

In 1971, 61% of Americans met the definition of Middle Class. In 2015, only 50% of Americans were middle income.
"A Portrait of America's Middle Class By the Numbers" by NPR
The U.S. Consumer Economy
The Consumer Economy makes up two-thirds of GDP
Middle Class Income Growth Has Been Fading Since 2000

The Red Arc above shows that Personal Income growth in the United States has been fading for 20 years. So far, under the Trump Administration, personal income growth has started to pick up, last reading +3.7% in February 2018. Following the Tax Reform of 2017, many American corporations announced $1,000 bonus payments to their rank and file employees. While these are only one-time payments, it represents a significant sum of money for millions of Americans.
The Big Picture
There is the Asset Economy & the Labor Economy
The Principal Policy Tools are Monetary Policy & Fiscal Policy
The Principal Actors are the Federal Reserve & the Government
The Stock Market Is Off Its All-Time High
Both the S&P 500 and the Dow Jones Hit All-Time Highs in January 2018. Then on Friday, February 2nd, the Commerce Dept. reported that Average Hourly Earnings increased by +2.9%. This pace of wage growth was well above market expectations, and sparked fears of inflation. This started a sequence of events, which ultimately resulted in a 10% stock market correction.

Since the $676 low in 2009, the S&P gained +319% through January 25, 2017. Then on Friday, February 2nd, the Commerce Department reported stronger than expected increase in wages, which sparked the VIX Crash and a 10% correction in the stock market averages.
Then in March, Trade War Fears set in

When Boasting about Stock Market Averages, The Dow Jones Industrial Average. A former colleague of mine would refer to the shape of this strong upward trajectory as a prom night chart - it's just asymptotic!.
The Path to 3%
I share the consensus view that 10-Year yields are heading back up to (the obvious target of) 3%. Financial Markets and asset price stability will depend on the rapidity and violence of the move. The VIX Crash in February highlighted the jitters in the stock market.
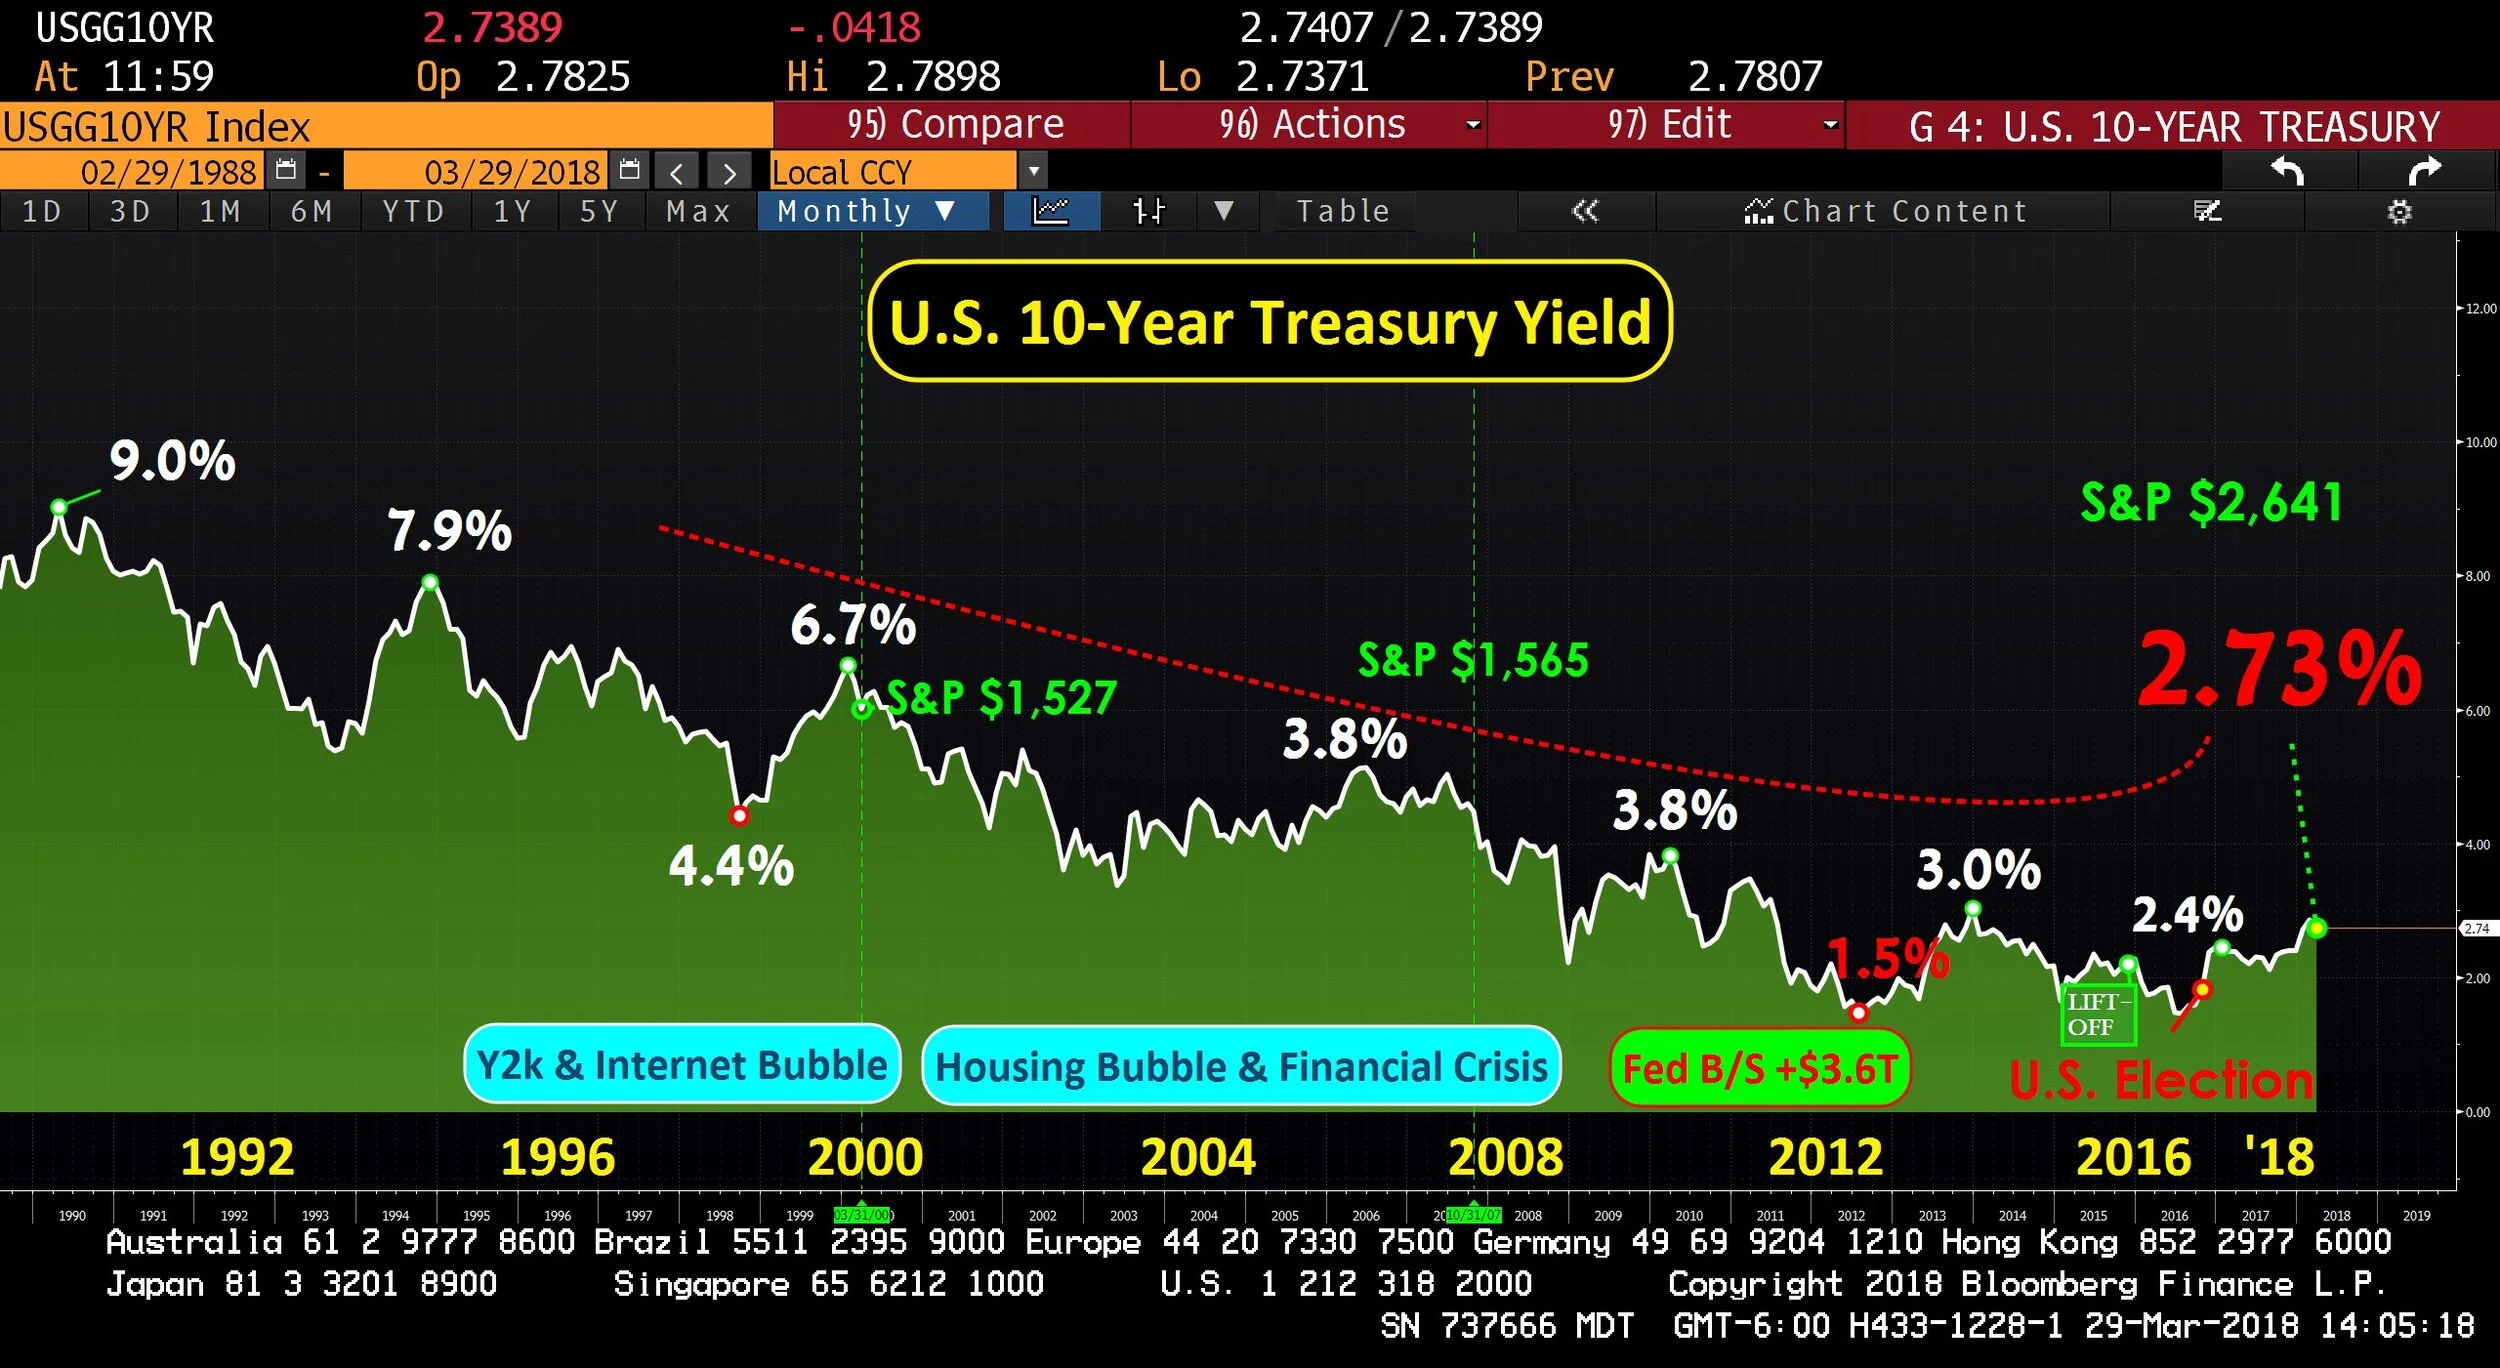
The red line shows the downward trajectory of ten year yield since the Internet Bubble. Since the 7% yield recorded in the mid 1990s, the 10-year bottomed at 1.5% before recovering to 2.4%. Note: More recently, the 10-year yield has backed off, falling almost 0.20% to 2.7%.
40-Year Old Reversal
If you’re less than Sixty, you’re a Virgin when it comes to Rising Interest Rates

The 40-Year Secular Decline In Interest Rates is Ending. From 1962 to 1979, America's insistence on both Guns and Butter (Vietnam and Lyndon Johnson's Great Society) exposed our economic flanks to the Arab Oil Embargo, and two oil shocks culminated in a nasty period of Stagflation. Fed Chairman Paul Volcker earned his spot in history with his decisive victory against inflation. In 1981, the yield on the U.S. 10-Year Bond set its generational high at 16%, and has since declined to 3%.
The Greatest Bull Market in Bonds fueled massive Bull Markets in All Asset Classes
U.S. Household Net Worth
Stagflation (1979) USD $8 Trillion with 10-Year around 16%
Cold War (1987) USD $18 Trillion with 10-Year around 10%
Y2K & Internet Bubble (2000) USD $42 Trillion with 10-Year around 6%
Housing Bubble (2007) USD $67 Trillion with 10-Year around 4%
QE Bubble (2017) USD $100 Trillion with 10-Year around 2.3%
Federal Reserve Statistical Release | Z.1 FInancial Accounts of the United States

In 1981, the U.S. 10-Year Treasury hit its generational high yield of 16% as Fed Chairman Paul Volcker tightened U.S. monetary policy to whip inflation. Falling interest rates boost asset prices (in all asset classes: stocks, bonds, real estate, etc.) through the discounting mechanism. By mathematical extension, zero interest rates would act as NOS (nitrous oxide system, a la Fast & the Furious).
The Situation on Wall Street
Wall Street is the Asset Economy
After 7 years of Zero Interest Rate Policy, aka ZIRP, the Fed is gradually increasing the Federal Funds Rate to "Normalize" monetary policy, which means gradually increasing the Federal Funds Rate, while also Reversing and Unwinding QE by Shrinking the Balance Sheet
The Market has flinched twice, so far, in February and March. Is the Market ready for November?
When the Irrational Exuberance of the Internet Bubble wore off, the Federal Reserve, under Chairman Alan Greenspan cut Fed Funds to 1% to relieve the U.S. Economy of the asset bubble hangover.
While conventional practice, 5 years of this medicine, dripped in steadily increasing doses, allowed another malady to gestate: the U.S. Housing Bubble. So when the Greenspan Fed finally took away the elixir of low interest rates, a swollen Housing Bubble finally bust.
This time, the throbbing of aftermath of the Financial Crisis pounded so hard, that the new Maestro tested unconventional medicine devised only in theory as an application to treat Japan's terminal deflation.
Under Chairman Ben Bernanke, the Fed administered a long and heavy dose of Zero Interest Rate Policy.

The U.S. Federal Funds Rate (also called "Fed Funds") is the interest rate at which Banks lend each other money on an overnight basis. The Fed Funds Rates is set by the Federal Open Markets Committee of the Federal Reserve (the "FOMC") and Fed Funds is a key determinant of the ultimate cost of borrowing for both Companies and Consumers.
During QE, the Fed injected $5 Billion Per Day into the markets. In Normalization, the Fed will remove $2 Billion Per Day.

Before 2008, the Federal Reserve balance sheet was a Pristine $755 billion, with the securities portfolio invested entirely in U.S. Treasuries. By 2015, the Fed balance sheet increased by 360% to $4.2 Trillion after 3 Rounds of Quantitative Easing. Of the $3.4 Trillion increase, the Fed purchased $1.7 Trillion in Treasuries to keep short term rates low, and another $1.7 Trillion in mortgage-backed securities to stimulate the effect of an interest rate cut below zero. By 2017, the Fed began to communicate its intent to "Normalize" its balance sheet.
Cognitive Dissonance (Reduced)
VIX measures the cost of stock market insurance. Since the steady application of QE during the Financial Crisis of 2008, VIX traded straight down to levels never before seen in history.

VIX is the measure of stock market insurance. Unless specified, VIX is usually associated with the S&P 500 Index.
The VIX Trade is an example of how the Fed's Unconventional Monetary Policies have distorted financial markets. Investors piled into VIX strategies, which essentially bet against the price of future stock market insurance, and were wiped out in a single day.

The Situation, Summarized
The Asset Economy benefited mightily from Low Interest Rates, then got turbocharged by Quantitative Easing. Normalization is underway, and the Fed will begin to reduce its balance sheet by November.

The Situation on Main Street
Main Street is Our Middle Class

Denver Blue Bear at the Convenstion Center.
Income Fuels the Consumer Economy
Consumer Sentiment Drives It
Can Wages Keep Up its Recent Gains
Apartment Rents
For Americans working hourly, there are two checks that matter most. The Paycheck and the Rent Check. How are these trending?
According the Atlanta Fed, wages growth accelerated from 2% to 3% in 2015, and nearly touched 4% growth at year end 2016, but the wage growth trend seems to be fading back down to 3%

Source: Federal Reserve Bank of Atlanta
Census Bureau data confirms wage growth, albeit at a different growth trajectory. The 2.8% increase in January 2018 triggered the February 2018 VIX-related selloff.

Source: Department of Commerce
However, the Rent Check is still growing faster than the Paycheck

Since the Financial Crisis, rental property values has increased significantly. This benefits owners of Rental Property, but squeezes Disposable Income for those who rent their housing. From 2011-2016, effective rent increased by 4.1% annually.
The Big Consumer Squeeze
Rent is rising faster than wages. In this example, if Rent took 45% of take-home pay in 2010, by 2016, Rent's share of the paycheck increased to 49%.


Here is the math to back up the illustration.
The Job Market
U-3 Overstates Economic Vitality

U-3 is the official Unemployment Rate. It measures people without work, but who have also been actively looking for work within the past four weeks. 1969: Unemployment got worse each economic recession, reaching 10% in 1982.
Underemployment is at All Time Lows. Is the Job Market tight?

U-6 Unemployment data series began in 1994. U-3 measures workers without jobs but who are still actively looking. A broader definition of Unemployment, U-6, also includes workers without jobs who have stopped looking for work, also known as discouraged workers. Finally, U-6 includes people working part-time because they are unable to find full-time employment. U-6 blew out to 17% during the Great Recession, but has improved significantly, approaching all-time lows.
For Both the Unemployed, and Underemployed, It has Never Been Better Time to Find a Job

U-6 Unemployment data series began in 1994, and it includes workers who may be working part time, but unable to find full time employment. U-6 blew out to 17% during the Great Recession, but has improved significantly, approaching all-time lows.

Yet The Labor Force Participation Rate is only 63%
At its Peak, Two-Thirds of Americans aged 16 and over were an active part of the Labor Force. Since that Peak, the Labor Force Participation Rate has declined steadily to 63% where it remains stuck. We deduce that as many as 10 million Americans are choosing not to participate in the labor force.

The U.S. working age population (defined 16 to 64 years of age) is approximately 200 million.
Confidence
The U.S. Consumer Drives 2/3 of the American Economy
This survey asks respondents to assess current business conditions and appraise their own income prospects. With U.S. GDP growth at 3% and U-3 unemployment at 4.1%, job openings are available, this survey should register strong results.

The Conference Board, Consumer Confidence Index
The Conference Board measures are surging with the latest reading of 127 approaching the highest on record
The University of Michigan survey asks respondents to assess current business conditions and appraise their own income prospects. It is important to note that University of Michigan also asks about future buying intentions. Note that the Confidence of Finding Work may not necessarily equal the Intention to Spend Wages.

Each month, 500 individuals are randomly selected from the contiguous United States (48 states plus the District of Columbia) to participate in the Surveys of Consumers. In order for the results to accurately represent the opinions of the population of the United States, it is important that each person selected participates. The questions asked cover three broad areas of consumer confidence: personal finances, business conditions, and future buying plans.
University of Michigan Consumer Sentiment Index
Personal Spending
Data Set: Wage Growth > Personal Income > Confidence > Personal Spending

Retail Sales

Personal Saving


Inflationary Pressures
CPI Has Not Achieved 3% in 20 Years

Reported monthly by the Bureau of Labor Statistics, CPI attempts to measure the change in prices paid by consumers for a market basket of consumer goods and services.
2% CPI in 2018

Note: Chair Janet Yellen noted an unusually large impact from falling cell phone plan prices, which lowered CPI by 20 basis points in 2017. This means CPI will increase to 2% in early 2018.
Inflationary Expectations
Expectations remain muted
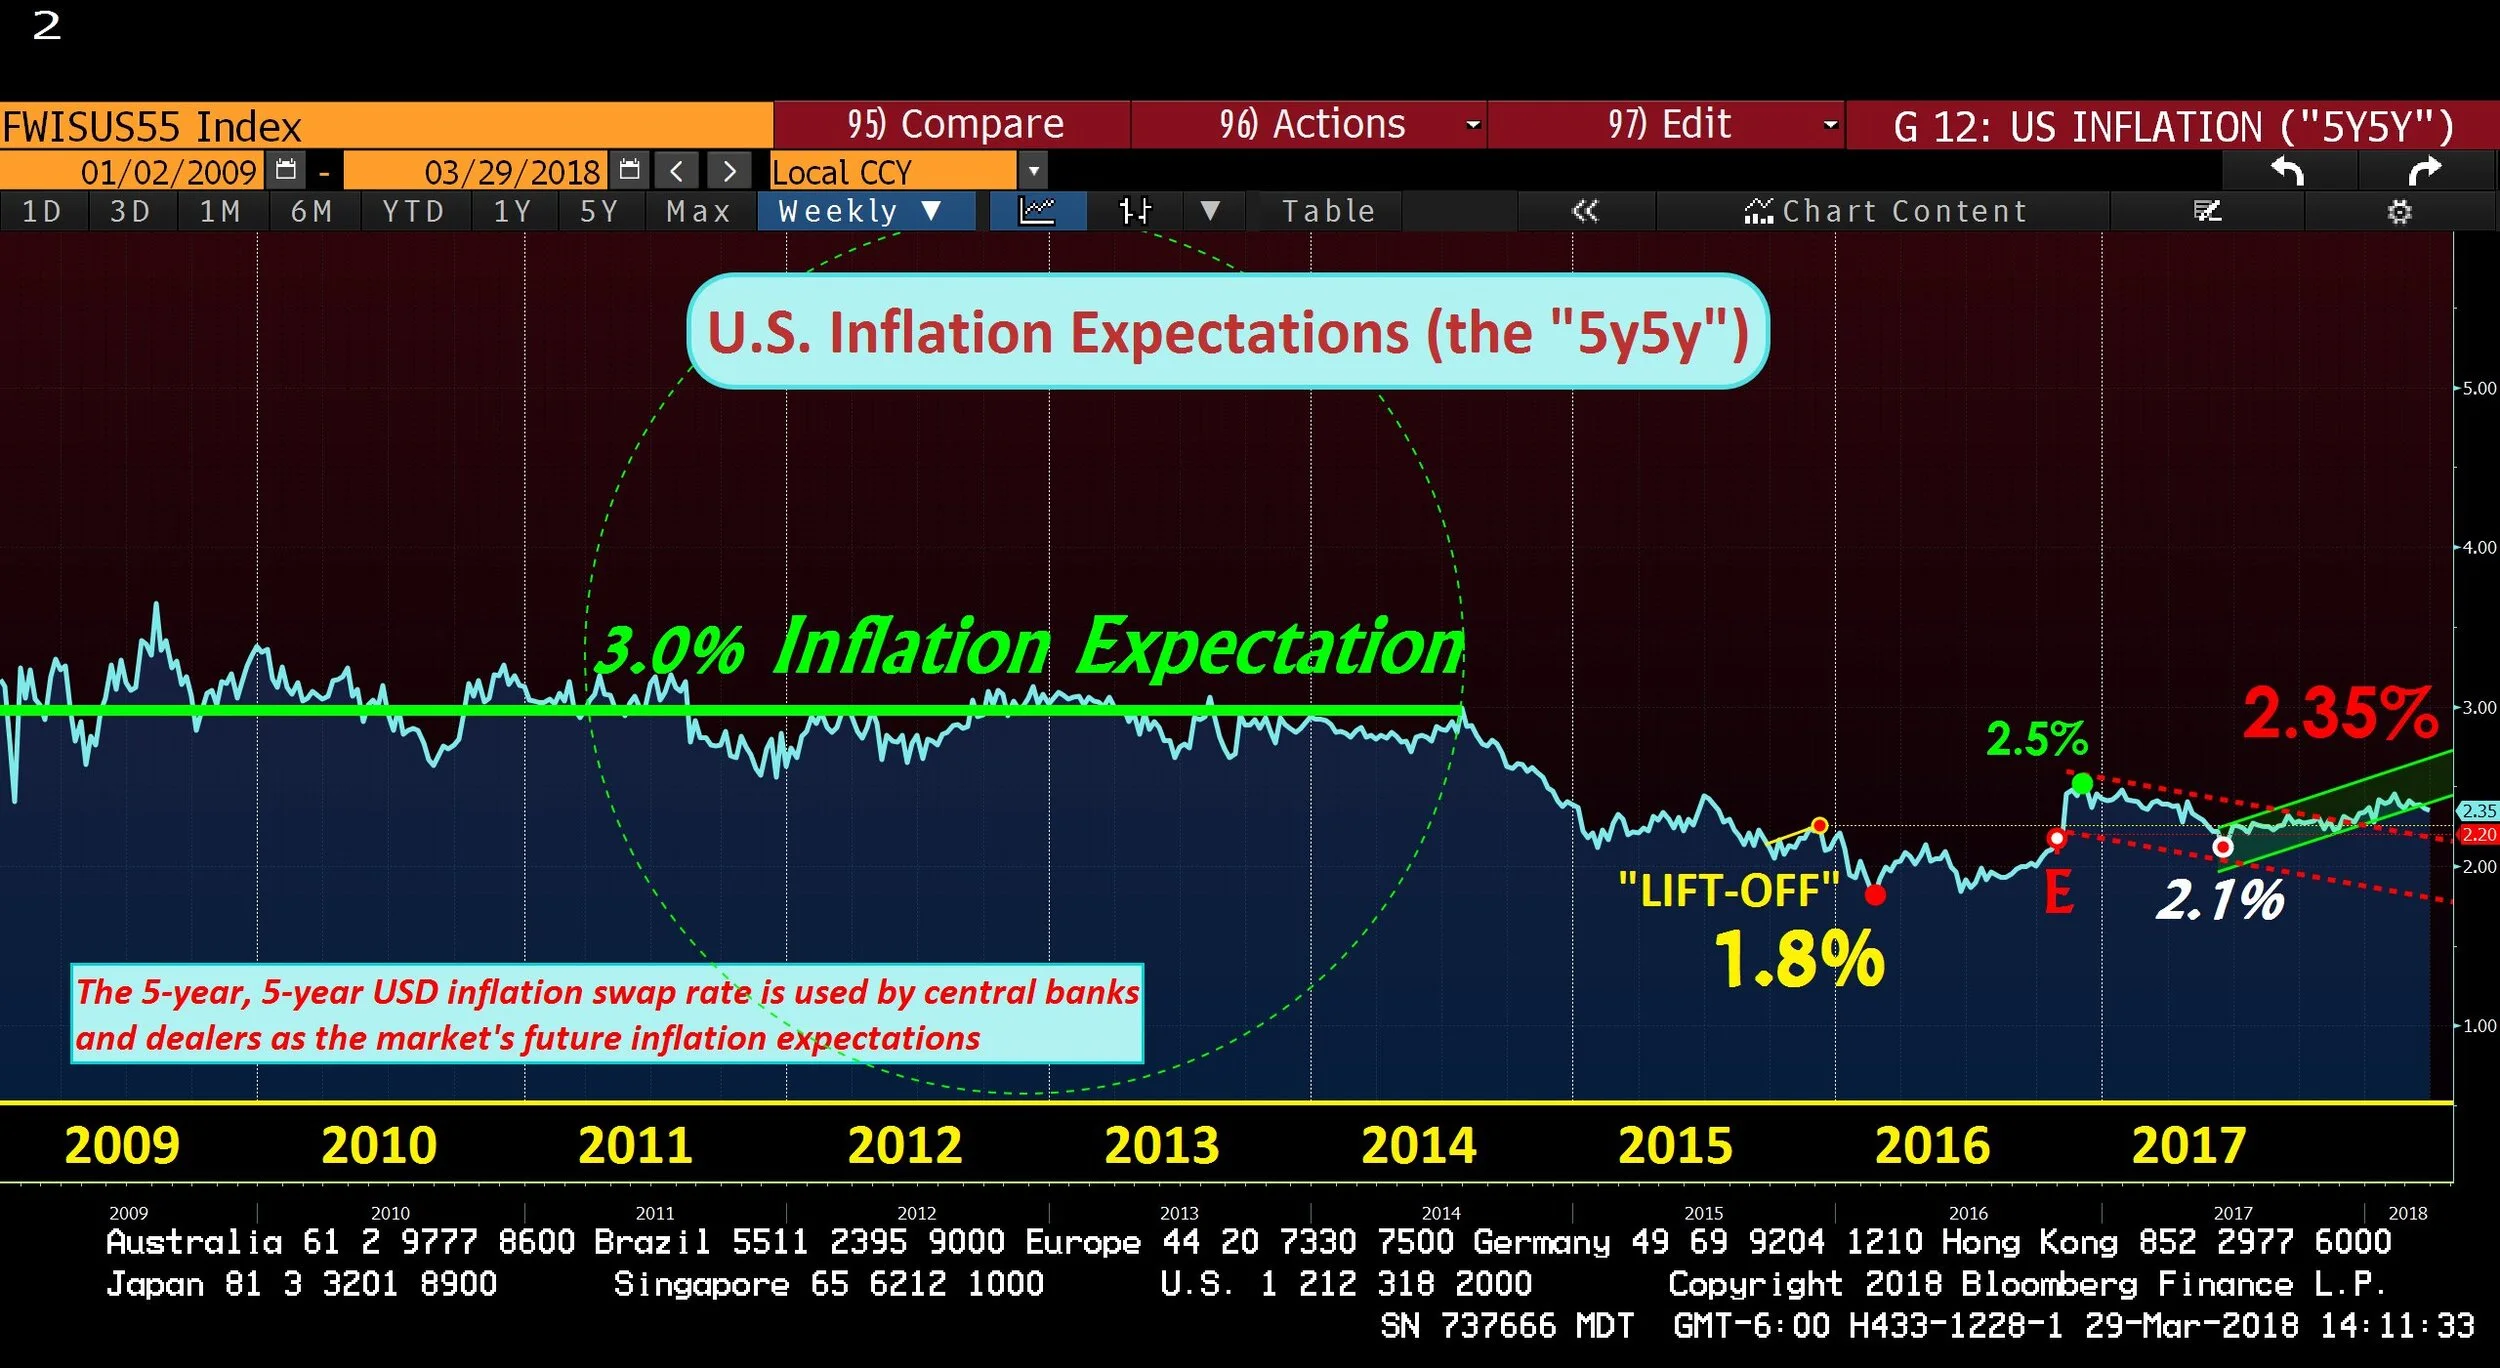
The 5-Year, 5-Year (5Y5Y) is the market's guess for the 5-year outlook for inflation, 5 years in the future. This rate also influences the price for U.S. Treasury Bonds.
Interest Rates
The U.S. Federal Funds Rate (also called "Fed Funds") is the interest rate at which Banks lend each other money on an overnight basis. The Fed Funds Rates is set by the Federal Open Markets Committee of the Federal Reserve (the "FOMC") and Fed Funds is a key determinant of the ultimate cost of borrowing for both Companies and Consumers.
To calm the Financial Crisis, The Fed and the United States Treasury led rescue efforts. The Treasury provided immediate relief with Bailout capital, to both Wall Street and Detroit. The Federal Reserve responded by implementing Ben Bernanke's Helicopter Money philosophy of the Zero Interest Rate Policy. Under Bernanke, the Fed lowered the Fed Funds rate to 0%. The Fed also purchased nearly $2 trillion of U.S. Government Bonds as well as nearly $2 trillion of Fannie Mae and Freddie Mac mortgage bonds from Wall Street.
Z.I.R.P. The Fed ZIRP-ed the American public to subsidize bank recapitalization.
Reflexively, changes in the cost of borrowing simultaneously impact the level of interest income earned by Savers in instruments such as savings accounts and certificates of deposit. American Savers continue to shoulder the cost of recovery from the Financial Crisis as interest rates have languished near 0%.

20-Year History of U.S. Federal Funds Rate: Fed Funds at 5.5% implies an American with $100,000 in savings earned, each year, at least $5,000 in (safe, consistent) interest income. Fed Funds Rate is starting to rise, but #Lift-Off has been under-powered relative to the lost savings income over the past decade.
Alan Greenspan served as Chairman of the Federal Reserve from 1987 to 2006. Greenspan was appointed by President Ronald Reagan and later reappointed by Presidents George H.W. Bush, Bill Clinton, and George W. Bush.
Chairman Ben Bernanke, served two terms as Chairman of the Federal Reserve (from February 1, 2006 to February 3, 2014). He was appointed by President George W. Bush and reappointed by President Obama.
Chair Janet Yellen, served as Chair of the Federal Reserve February 3, 2014 to February 2017. She was appointed by President Obama.
The New Chairman of the Federal Reserve Bank is Jerome Powell. He was appointed by President Donald Trump.
<3-Month LIBOR>
The London Interbank Offered Rate (LIBOR) is the reference interest rate for trillions of dollars of financial derivative contracts. LIBOR continues to climb higher each week.

Under Alan Greenspan, 3-month LIBOR declined from 5.5% to a low of 1% in 2003. Coincidentally, and perhaps causally, the U.S. home market started to boom. Interest rates (3-month LIBOR) normalized to 5% by 2006. Then, in 2007, the Housing Bubble began to burst, creating a Financial Crisis and the Great Recession. Fed Chair Ben Bernanke then introduced the Zero Interest Rate Policy, or ZIRP.
<U.S. 10-Year Treasury Yield>
The Stock Market tends to steal the spotlight, but it is the Bond market that warrants attention -- The way in which the 10-year yield climbs to 3% is what matters.

Depicted above is the U.S. 10-Year Treasury Yield, going back to 2009, the Housing Bubble and the Financial Crisis.
U.S. Dollar & FX
The U.S. Dollar Index is the trade-weighted basket of major foreign currencies. The Canadian Dollar is 12% of the Dollar Index. The Japanese Yen makes up another 12%. The remaining ~75% is comprised of the Euro and other European currencies.

From 2014 to 2016, the Dollar Index has surged three times to 100, but failed to break above this level. Now, despite rising U.S. Federal Funds Rate, the Dollar Index is breaking down below 90.
<U.S. Dollar Index & 10-Year Treasury Yield>
From 2014 to 2016, the Dollar Index has surged three times to 100, but failed to break above this level. Now, despite rising U.S. Federal Funds Rate, the Dollar Index is breaking down below 90.

In Red, the U.S. Dollar Index which peaked at 151 in 1984 and hit another high at 119 in 2001. In white, the U.S. 10-Year Treasury Yield over the same time period.
China

I published this article in March 2018
Special Trade War Update | Act I. Domestic Political Economy
"I don't blame China. Who can blame a country for being able to take advantage of another country for the benefit if its citizens? I give China great credit,” Trump joked (Fox News)
After joining the World Trade Organization in 2001, China accumulated $4 Trillion in foreign exchange reserves in just 12 years

After years of tariff negotiations, China joined the World Trade Organization on December 11, 2001. China pursued an Export led economic growth strategy which led to the accumulation of USD 4 trillion of foreign exchange reserves. Note that China's FX reserves have stabilized at $3 trillion.
<China Oil Demand> This is the most important demand chart for oil, the world's most important commodity.

In 2002, China used approximately 4.9 million barrels per day of crude oil. By 2012, China daily oil demand grew by 5.7 million barrels to 10.6 million - a rate of annual increase of 570,000 per year. From 2014 to 2016 Apparent Demand topped at 10.6 million barrels per day, but has recently broken above this previous high.
Oil
The World's Most Important Commodity

It is about the U.S. Energy Renaissance
Gold
This is a current writing project

The Barbaric Relic